Research · Sport · Marceau Club Capital
The price of ambition
Why the right level of investment in a football club can be calculated, not guessed or negotiated.

Every football club owner asks the same question: how much should I put in? Most answer it with a budget and a hope. Banks learned long ago to answer questions like it with a price. Clubs can now do the same.
Ambition in football is expensive, and nobody disputes that. What is rarely made explicit is how expensive, and what exactly the money buys. An owner who adds £10 million to a Championship wage bill is not buying promotion. He is buying a change in the odds of promotion — perhaps from 15% to 30%, perhaps from 15% to 17%. Those are very different purchases at the same price.
Our argument is simple. The right level of investment for a club is not a number to be negotiated between a manager who wants more and a finance director who wants less. It can be calculated: as the point where one more pound stops buying enough probability of success, or enough club value, to justify the risk it adds. We call that number the price of ambition.
This is not just a theory. We tested the engine at the heart of the approach on 13 Championship seasons it had never seen, and it shows the same pattern every owner should know: strength concentrates the odds, money explains what past results miss, and the price of ambition moves with what rivals do.
Why the usual answer needs to improve
In most clubs, next season's budget is last season's budget, adjusted by the manager's requests, the owner's mood and the transfer market's temperature. It is often a negotiation, rarely a scientific calculation. Three features of football make that approach unusually costly.
The prize is a cliff, not a slope. Deloitte estimated that winning the 2026 Championship play-off final was worth at least £205 million over three seasons, rising to about £365 million if the club stays up (AFP via The News, Inside World Football via Pulse). Finishing one place outside the play-offs is worth almost nothing by comparison. When the reward is a cliff, the value of investment is not proportional to the money spent.
Money buys odds, not outcomes. The relationship between wage spending relative to rivals and league position is one of the most robust findings in football economics, but it holds on average, not in any one season. Injuries, managers and luck decide the rest. A budget that does not say what probability of success it buys is not really a plan.
The cost is carried for years. Wages are committed for the length of contracts and transfer fees are paid in instalments. An all-in push that fails leaves the club with the costs of a promotion squad and the revenues of a second-tier club. That is how the Championship came to lose, on average, around 59% of its revenue, with clubs needing 57p of outside money for every £1 they earn (Norton Rose Fulbright summary of the IFR's State of the Game report).
What the price of ambition looks like
The answer comes as a frontier. We simulate thousands of seasons for each level of investment, with the squad, contracts, revenues and rules of the club, and plot the chance of reaching the target against what it costs.
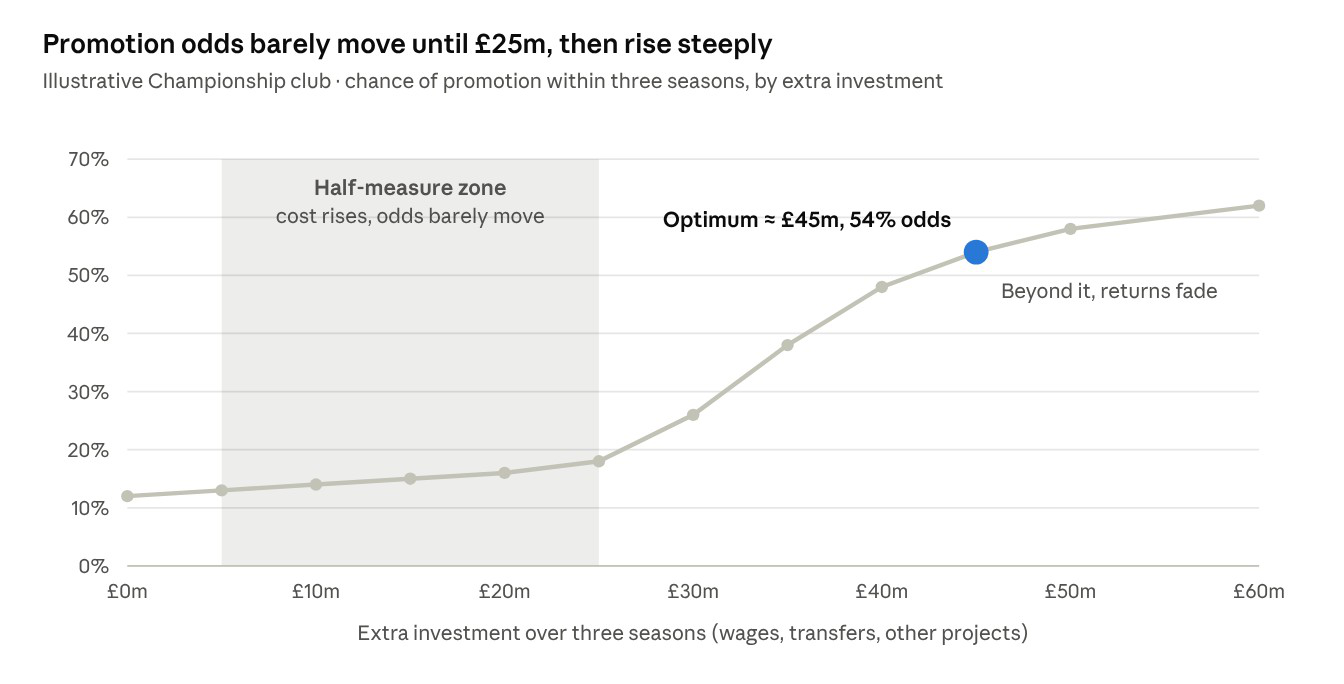
In this illustrative case, a Championship club with a mid-table squad has a 15% chance of promotion on its current plan. Adding £10 million takes it to only 18%: the money improves the squad, but not enough to change its rank among rivals. Between £25 million and £45 million the odds rise steeply, because each signing now lifts the club into the group of real contenders. Past about £45 million, each extra pound buys less, while the downside if it fails keeps growing. That turning point is this club's price of ambition.
Does it hold up? Thirteen seasons of evidence
We built the sporting engine of the model — the part that turns squad strength into odds — and tested it on every Championship season from 2013/14 to 2025/26, using only what was known before each season started. All settings were fixed on earlier seasons first, so the test is genuinely out of sample.
| What happened, 2013/14–2025/26 (312 club-seasons) | Result |
|---|---|
| Promotion rate of the model's three pre-season favourites | 44% |
| Promotion rate of clubs the model ranked 7th or lower | 6% |
| Pre-season rank of the typical (median) promoted club | 4th |
| Accuracy vs giving every club equal odds (Brier skill score) | 9% better on promotion, 4% on relegation |
| Share of the final ranking explained by pre-season strength | about a third (rank correlation 0.34) |
Two lessons stand out. Strength concentrates the odds: favourites are seven times more likely to go up than the pack. But the Championship remains one of the least predictable leagues in football, so a plan should be judged on the odds it buys, never sold as a promise.
Money explains what results alone miss. Clubs relegated from the Premier League arrive with parachute payments and far larger wage budgets. They are a natural experiment in what money does to a club's odds.
| Championship clubs, 2013/14–2025/26 | Club-seasons | Average points | Promoted | Model forecast from results only |
|---|---|---|---|---|
| First season after Premier League relegation | 39 | 74.5 | 36% | 21% |
| Second season after relegation | 23 | 66.4 | 17% | 16% |
| All other clubs | 250 | 60.6 | 8% | 11% |
First-season parachute clubs went up more than four times as often as the rest, and a model built only on past results underestimated them by 15 percentage points. Their edge is resources: wages, depth, the ability to keep their best players. This matches the best-known finding in football economics: over a decade, relative wage spending explains around 90% of the variation in average league position in the Premier League and Championship (Szymanski, Open University). It is why Club Capital combines sporting data with each club's finances.
The backtested engine also reproduces the shape of the illustrative frontier above: odds barely move for a mid-table squad, rise steeply once a club becomes a genuine contender, then flatten. What is not yet backtested is the conversion of pounds into squad strength; that step needs club wage data and is under way (see How we tested it).
Three things the frontier teaches
1. The most expensive choice is the half-measure. On the frontier, the middle of the curve is where money is spent without materially changing the odds: enough to raise costs and commitments, not enough to clear the threshold. Our illustrative club spending £25 million instead of £15 million barely moves its promotion odds while adding £10 million of risk. The rational choices are usually at the ends: invest decisively enough to give promotion a real chance, or consolidate, build value and wait for a better moment. Many clubs live in the middle, and pay for it.
2. The squad is a balance sheet, and most clubs don't read it. Accounts show players at amortised cost; academy graduates appear at zero. Marked to their market value, most squads hold a hidden reserve, and players whose contracts are running down are losing value every month, like a bond approaching maturity with no coupon. Reading the squad as a portfolio changes the question from "how much can we spend?" to "which assets should we hold, extend or sell to fund the next step?" Under the new squad cost rules, a profitable player sale also creates room to spend, so the asset view is now a regulatory one too.
3. Every budget implies a price — make it explicit. An owner who signs off a £40 million push is, whether he knows it or not, saying that a given rise in promotion odds is worth more to him than its financial return. The frontier makes that implied price visible: "your plan values promotion at £X million beyond what it pays back". That is a perfectly legitimate choice: owners invest in football for pride, community and legacy as well as money. But it should be a decision, taken with the numbers on the table, not an accident of the transfer window.
The frontier moves: what shifts the price of ambition
A club's frontier is not fixed. It shifts whenever something changes the strength of its rivals, the cost of strength, the value of the prize or the money available. These are the drivers that matter most, ranked by how much they move a club's position.
| Rank | Driver | What it moves | Evidence of size |
|---|---|---|---|
| 1 | Relative squad strength | The odds of every outcome | Favourites promoted 44%, clubs ranked 7th or lower 6% (our backtest) |
| 2 | Spending power: central money, parachutes, owner funding | The strength a club can afford | Parachute clubs promoted 36% vs 8% (our backtest) |
| 3 | Rivals' investment | The strength needed to reach the target | About 4 extra points of strength needed if the top three rivals strengthen (chart below) |
| 4 | Continuity of owner funding | Whether the plan survives | 29% of clubs could not last 30 days without new owner money (IFR) |
| 5 | Cost-control rules | The ceiling on spending; the value of player sales | Squad costs capped at 85% of revenue from 2026/27 |
| 6 | Revenue at risk by tier | The cost of failure and the value of the prize | Promotion worth at least £205m (Deloitte); relegation covenants at 60% of Premier League clubs (IFR) |
| 7 | Transfer and wage market prices | The cost of each unit of strength | To be measured in the full model |
| 8 | Competition format | The routes to the prize | Six-team play-off: under 2 points of promotion odds at any strength (our simulation) |
| 9 | Financing conditions | The cost of debt and transfer factoring | Net transfer debt of about £3.4bn across English football (IFR) |
To show how much the environment matters, we took a mid-table Championship club, varied its strength and re-ran this season's competition thousands of times under different scenarios.
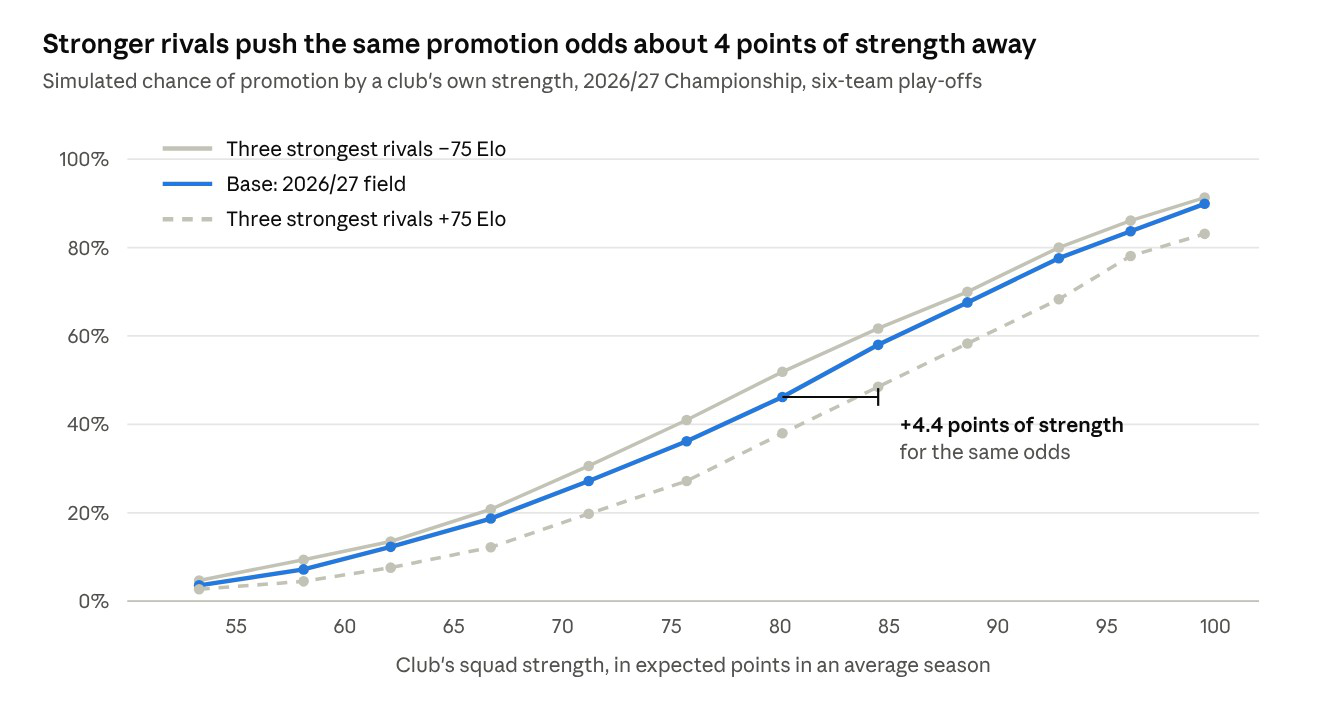
Rivals' spending is the biggest sporting stress. When the three strongest rivals strengthen by about the gap between a mid-table side and a parachute club, a club with a 46% chance of promotion drops to 38%, and needs about 4 more points of squad strength to get back. Weaker rivals move the curve the other way by a similar amount. The new six-team play-off, by contrast, changes little: under 2 percentage points at any strength.
Financial stresses act on the other side of the frontier. Owner withdrawal, relegation or a revenue shock do not weaken a squad on day one; they change what the club can afford and how long it can carry the plan. The conclusion is practical: a club's price of ambition must be relative to its rivals, recomputed each transfer window, and tested so that the chosen plan stays acceptable in every scenario, not just the base case.
Why the maths has just changed
Until now, an owner willing to keep writing cheques could largely set his own price of ambition. From this season, two changes put limits and scrutiny around it.
Spending is now tied to revenue. From 2026/27, Premier League clubs may spend up to 85% of football revenue (plus net profit on player sales) on squad costs, and 70% if they play in Europe (Premier League). The Championship has moved to a similar 85% rule, with a cap on how much owner money can count towards it (EFL statement). Ambition now has to be funded within a ratio, which makes the club's revenue mix, its player trading and its asset values part of the same equation.
The regulator is watching the cash. The Independent Football Regulator's first State of the Game report found that 29% of clubs could not last 30 days without new owner money, and that liquidity was the strongest predictor of financial distress (Norton Rose Fulbright). Every club in the top five tiers now needs a licence, a strategic business plan and, by May 2028, three stress tests with credible responses. An aggressive investment plan will have to show it survives relegation, failure to go up and the loss of owner funding.
Together these changes turn the price of ambition from a private matter between owner and manager into something the club must be able to explain and defend: to its board, its league and its regulator. That is a constraint. It is also an opportunity, because the analysis that satisfies the regulator is the same analysis that tells an owner where his money works hardest.
Five questions every chairman should be able to answer
- What are our odds today? Given the current squad and budget, what is the probability that we go up, stay up or reach our target this season and over three seasons?
- What does the next £10 million buy? In points, in percentage points of probability, and in club value — and is that the same answer for wages, for a transfer, for the academy or for the training ground?
- What is our squad really worth? Marked to market, not at book value: where is the hidden reserve, which players are losing value as contracts run down, and how much spending room would a sale create under the new rules?
- What happens if it goes wrong? Cash runway in days if we miss the target, if we are relegated, or if the owner's funding stops — and what we would do in each case.
- What price are we putting on ambition? How much of this year's investment is justified by the financial return, and how much by the owner's wider goals? Is that a choice the board has made consciously?
Few clubs can answer all five today. Those that can will make better decisions in the transfer window, write a stronger licence application and talk to investors and lenders with more credibility.
To see your own club's frontier, start with our free licence readiness check.
How we tested it
Data. Every Premier League, Championship and League One match from 2004/05 to the start of 2026/27, about 32,500 matches (football-data.co.uk). Promotion and relegation, including play-off winners, are read from the division each club played in the following season.
Model. Each club has a strength rating (Elo) updated after every match, with an adjustment when it changes division and a pull back towards the average each summer. For each season, only the pre-season ratings are used to simulate every match and the play-offs 4,000 times, with an allowance for how uncertain a squad's strength is in August.
Out-of-sample test. All settings were chosen on 2006/07–2012/13, then the model was tested unchanged on 2013/14–2025/26: 312 club-seasons, 39 promotions, 39 relegations. Accuracy is measured with the Brier score against a forecast giving every club the league's base rate.
What is not yet tested, and the next steps. The backtest validates the sporting engine, not the frontier in pounds, because match data says nothing about spending. We are now adding each Championship club's wages and revenue from its statutory accounts (2012/13 onwards), to fit how much strength each extra £1m of wages has bought and to test what the frontier would have recommended in past seasons. Accounts are published late, year-ends differ and bonuses blur wage figures, and with 39 promotions all estimates carry sampling error.
Note on the examples: the first frontier chart (investment in pounds) is illustrative, built to show the typical shape. The backtest and stress-test figures come from the tested model described above. A real club's frontier depends on its own squad, contracts, revenues and rules.
About Marceau Club Capital
Banks spent the fifteen years after 2008 learning to price risk, mark their assets to market and allocate capital to where it earns its keep, under the eye of demanding regulators. Football is now entering the same world.
Marceau Club Capital is part of Marceau Partners. It brings that discipline to clubs. It combines a season simulation model, a player book that marks every player to value, a full financial model with the new cost-control and licence rules built in, and an optimiser that finds the right level and mix of investment for the owner's ambition and risk appetite. The same model produces the IFR licence business plan and stress tests.
It is led by Dr Colin Lawrence, former senior UK financial regulator, former Chief Risk Officer of a large investment bank and a University of Chicago-trained economist.
About the authors

Alice Howitt
Alice studied sports management, writing her dissertation on the commodification of tennis players. She has worked extensively across the sports industry, including with Wimbledon and a number of other sports clubs. She brings a commercial view of how sports organisations build revenue and value.

Riccardo Casonato
Riccardo's focus is modelling and analytics. He studied civil engineering at Imperial College London and has contributed to models in other industries, including capital markets and private equity. He brings that quantitative rigour to the simulation and financial models behind Marceau Club Capital.

Dr Colin Lawrence
Colin is a former senior UK financial regulator and a former Chief Risk Officer of a large investment bank. A University of Chicago-trained economist, he leads Marceau Club Capital.
Sources
- Match results: football-data.co.uk, English leagues, 2004/05 to 2026/27 (to date)
- AFP via The News, Hull promoted to Premier League after McBurnie strikes late in play-off final, 25 May 2026 (Deloitte estimate)
- Inside World Football via Pulse, Forget Spygate, the play-off final is all about the money, 22 May 2026
- Norton Rose Fulbright, IFR's draft State of the Game Report: key findings and supervisory implications, 15 October 2026
- Premier League, New Premier League financial system explained
- FC Business, EFL clubs approve changes to financial control rules, May 2026
- City AM, Championship play-offs: more clubs to get shot at football's richest game, March 2026
- S. Szymanski, Stefan Szymanski on the business of football, Open University
- S. Kuper, Football's most perfect meritocracy, Engelsberg Ideas