Research · Markets & FX
What has really happened in the FX markets in the last 3 years: Part 1
Part 1: understanding the market dynamics
Read aloud · 14 min 51
Preamble: methodology and data quality considerations
This article is merely based from the Bank for International Settlements' 2025 Triennial Central Bank Survey which represents the gold standard for FX market sizing, with 52 participating jurisdictions collecting data from over 1,100 dealers.
However, several methodological considerations deserve note:
Coverage and reporting basis
Data reflect sales desk location, not trading desk location, meaning transactions are attributed to where customer relationships reside rather than where hedging occurs. This provides the most economically meaningful view but can create discrepancies with regional surveys using different methodologies.
Double-counting adjustments
The "net-net" figures presented in the analysis eliminate both local and cross-border inter-dealer double-counting, providing accurate market size estimates. However, this adjustment means institutional-level turnover data won't match market-level aggregates—a frequent source of confusion in market analysis.
Exchange rate effects
The modest dollar appreciation between 2022 and 2025 slightly understates reported 2025 values in dollar terms. At constant exchange rates, growth would appear marginally higher, though not materially affecting conclusions.
Survey timing
April's specific circumstances—trade policy volatility—mean 2025 figures may not fully represent typical annual activity. The BIS addresses this through monthly averaging and comprehensive coverage, but single-month snapshots always carry timing risk.
Executive Summary
The evolution of the FX markets over the last 3 years reveals structural shifts in currency trading landscape and a 28% surge as volatility drives record trading activity
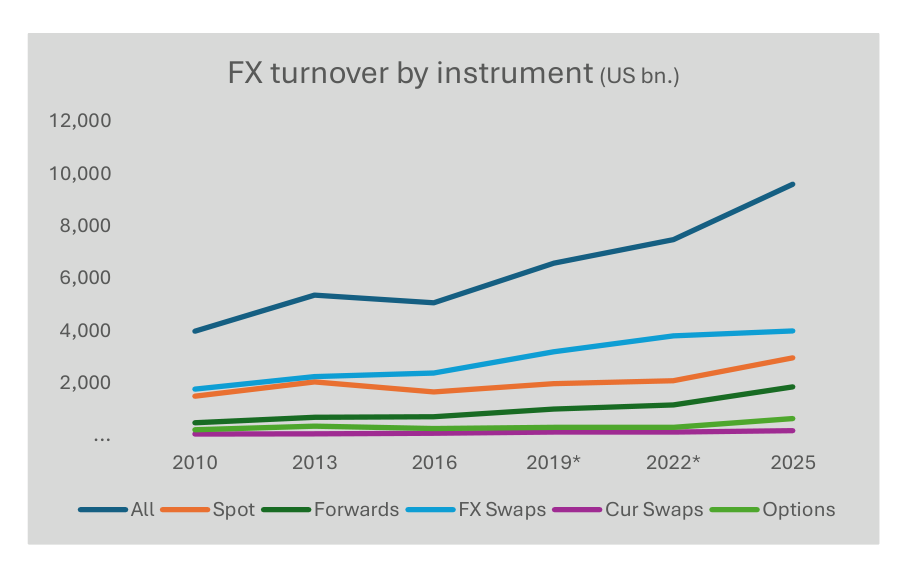
The global foreign exchange market reached unprecedented scale in April 2025, with daily turnover averaging $9.6 trillion—a 28% increase from $7.5 trillion three years earlier. This surge, captured in the Bank for International Settlements' latest Triennial Central Bank Survey, reflects not merely market growth but fundamental shifts in trading patterns, currency dominance, and market structure that will reshape competitive dynamics across financial services.
The April 2025 survey coincided with heightened volatility following major trade policy announcements, providing a stress-test view of market resilience and revealing which instruments, currencies, and participants gained—or lost—ground during turbulent conditions.
The instrument shift: hedging trumps liquidity management
Outright forwards lead the charge
The most striking structural change appears in instrument composition. Outright forwards (contracts locking in future exchange rates) exploded 60% in turnover, capturing 19% of global volume versus just 15% in 2022. This dramatic shift signals that market participants prioritized directional risk management over traditional liquidity operations.
Spot transactions similarly surged 42%, increasing their market share from 28% to 31%. The combination of rising spot and forward activity suggests a market driven by active hedging decisions rather than passive portfolio rebalancing.
FX swaps lose dominance
Conversely, FX swaps, despite growing in absolute terms to $4 trillion daily, saw their market share plummet from 51% to 42%, marking their lowest proportion since 2010. These short-maturity instruments, traditionally used for funding liquidity management, appear to have been displaced by more directional trading as volatility created both opportunity and necessity for explicit currency positioning.
This relative decline carries profound implications: it suggests institutional treasurers and asset managers shifted from routine balance sheet management toward active currency risk decisions. The consulting opportunity here centres on helping financial institutions optimize their FX operations for a more volatile, directional market environment.
Options market doubles
Perhaps most revealing, FX options turnover more than doubled, reaching 7% of total volume versus 4% in 2022. This surge reflects sophisticated risk management, as options provide asymmetric payoff profiles ideal for uncertain environments.
The doubling of options activity indicates that corporate treasurers, institutional investors, and hedge funds all sought more nuanced hedging tools; a trend likely to persist given ongoing geopolitical and economic uncertainty.
Currency dynamics: dollar dominance intensifies while sterling stumbles
The Greenback's inexorable rise
The US dollar's already dominant position strengthened further, appearing on one side of 89.2% of all trades (up from 88.4%). This intensification of dollar centrality, despite considerable speculation about de-dollarization, underscores the currency's unassailable role as the global vehicle currency.
For financial institutions, this reality demands continued investment in dollar liquidity management infrastructure and relationships, regardless of strategic diversification aspirations.
The Renminbi's steady ascent
The Chinese renminbi continued its decade-long climb, reaching 8.5% market share from 7.0% in 2022. More significantly, USD/CNY trading surged 59%, reaching 8.1% of global turnover. This growth occurred despite, or perhaps because of, ongoing capital controls and geopolitical tensions, suggesting the renminbi's internationalization proceeds through commercial necessity rather than financial liberalization.
The consulting implication: multinational corporations require more sophisticated renminbi treasury capabilities, particularly as China-exposed supply chains and revenue streams make CNY exposure increasingly material.
Swiss Franc surges as safe haven
The Swiss franc's leap to 6.4% market share (from 5.2%), with USD/CHF trading up 60%, reflects its intensified safe-haven status. In volatile periods, the franc's liquidity and Switzerland's stability attract defensive positioning; a pattern likely to continue given elevated global uncertainty.
Sterling's dramatic retreat
British pound market share fell sharply to 10.2% from 12.9%, with USD/GBP volumes declining relative to overall market growth. This retreat—dropping below the currency's long-term 13% average; likely reflects Brexit's lingering economic impact and the UK's diminished relative economic weight.
For London-based financial institutions, this poses strategic challenges: maintaining the city's FX market leadership (38% of global volume) becomes more difficult when the home currency loses relevance.
Hong Kong Dollar's resurgence
The Hong Kong dollar's share nearly doubled to 3.8% from 2.6%, with USD/HKD trading up 95%. This surge, despite geopolitical concerns about Hong Kong's autonomy, demonstrates the city's enduring role as China's international financial gateway. The HKD's renewed prominence suggests market participants separate Hong Kong's financial infrastructure value from political considerations.
Counterparty analysis: institutional investors drive growth
Non Banks Financial Institutions (NBFIs) gain share
Trading with NBFIs (encompassing non-reporting banks, institutional investors, hedge funds, and proprietary trading firms) reached $4.8 trillion daily, capturing 50% of global turnover (up from 47%). Within this category, turnover with institutional investors rose to 13% of global volume from 11%, marking the first relative increase since 2016.
This shift reflects institutional investors' need to actively manage FX risk as currency volatility impacted portfolio returns. Asset managers with international exposures faced stark choices: accept currency losses or hedge dynamically. Many chose the latter, driving institutional participation.
Non-Financial Corporate Retreat
Conversely, non-financial customer share continued its decline to just 5% from 6% in 2022 and 7% in 2019. This might seem paradoxical given elevated volatility but likely reflects two factors: corporations increasingly use financial affiliates (counted as NBFIs) for FX operations, and many locked in longer-term hedges that reduced April trading activity.
The consulting opportunity centres on helping corporations optimize their FX risk management frameworks; determining appropriate hedge ratios, tenor structures, and organizational approaches that balance cost, effectiveness, and operational efficiency.
Inter-dealer stability
Inter-dealer trading remained virtually unchanged at 46% of global turnover, suggesting market-making capacity kept pace with customer demand growth. However, the 72% surge in outright forwards and 50% increase in spot transactions with NBFIs indicates dealers faced significantly elevated customer flows requiring sophisticated risk management.
Geographic concentration: Singapore's rise, London's endurance
Top four dominate
The UK, US, Singapore, and Hong Kong intermediated 75% of global FX trading, maintaining high concentration despite technology theoretically enabling geographic dispersion.
Singapore's breakthrough
Singapore's market share surged to 11.8% from 9.5%, continuing its emergence as Asia's premier FX hub. This growth reflects deliberate policy choices; favourable regulation, infrastructure investment, and time zone advantages serving both Asian and European hours.
For financial institutions, Singapore's rise presents both opportunity and competitive threat. Banks with strong Singapore operations gain access to growing Asian FX flows; those without face strategic disadvantage in the world's fastest-growing economic region.
London's resilient leadership
Despite sterling's decline and Brexit uncertainties, London retained 38% of global FX turnover, remaining the world's dominant centre. This resilience demonstrates deep liquidity, network effects, and institutional capabilities that transcend any single currency's fortunes.
However, maintaining this position requires continuous investment. Competitors like Singapore grow through innovation and deliberate positioning; London must do likewise or risk gradual erosion.
US market share stable
The United States held steady at approximately 19% of global turnover, reflecting its position as the dollar's home market and a major financial centre, though trailing London's international entrepôt role.
Market structure: the rise of non-market-facing trades
Back-to-back and compression trades
The 2025 survey continued the 2022 innovation of separately identifying "non-marketfacing" trades; back-to-back deals automatically following customer trades and compression trades optimizing portfolios. These totalled $1.2 trillion daily, or 13% of global turnover (up slightly from 12%).
This granularity matters because it separates genuine market-facing activity contributing to price discovery from internal risk management and operational flows. For analysts, the "true" market is arguably the $8.4 trillion in market-facing trades rather than the headline $9.6 trillion figure.
Cross-border trading remains dominant
Cross-border transactions accounted for 63% of global turnover, little changed from 62% in 2022, confirming FX remains an inherently international market. This stability suggests technological advances and regulatory changes haven't fundamentally altered the market's geographic distribution of activity. Maturity structure: short-term focus persists
For FX swaps, 68% of turnover occurred in contracts of seven days or less, maintaining the instrument's role in very short-term funding management. However, the relative shift toward spot and outright forwards, which don't share this maturity concentration, means the overall market became somewhat longer-dated in its risk profile.
Outright forwards showed more balanced maturity distribution: 34% up to seven days, 30% between one week and one month, and 28% between one and three months. This diversity indicates hedging activity across multiple time horizons, from immediate trade execution to quarterly budget rate protection.